Data Analysis Project: House Sales in King County, USA
For this assignment, I used python to analyze and predict housing prices using attributes and features such as square footage, number of bedrooms, number of floors and so on.
Here is the dataset: House Sales in King County, USA
This report provides details of our attempt to predict house prices using various regression methods. I will make use of data of house prices in King County, Washington State, USA for sales in 2014 and 2015.
Our main, predictive question is:“Is it possible to predict the sale price of a house from information about that house such as the size, number of bedrooms, condition etc?”
The Dataset
The dataset contains house sale prices for King County, which includes Seattle. It includes home sold between May 2014 and May 2015
id :a notation for a house
date: Date house was sold
price: Price is prediction target
bedrooms: Number of Bedrooms/House
bathrooms: Number of bathrooms/bedrooms
sqft_living: square footage of the home
sqft_lot: square footage of the lot
floors :Total floors (levels) in house
waterfront: House which has a view to a waterfront
view: Has been viewed
condition: :How good the condition is Overall
grade: overall grade given to the housing unit, based on King County grading system
sqft_above :square footage of house apart from basement
sqft_basement: square footage of the basement
yr_built: Built Year
yr_renovated :Year when house was renovated
zipcode:zip code
lat: Latitude coordinate
long: Longitude coordinate
sqft_living15: Living room area in 2015 (implies-- some renovations) This might or might not have affected the lotsize area
sqft_lot15 : lotSize area in 2015 (implies-- some renovations)
The Questions
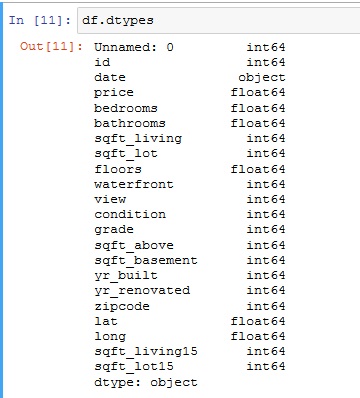
Question 1: Display the data types of each column using the attribute dtype, then take a screenshot and submit it, include your code in the image.
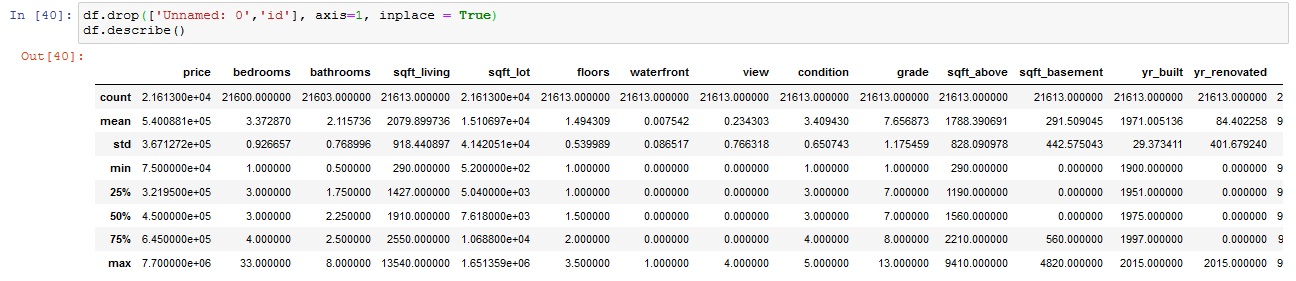
Question 2: Drop the columns "id" and "Unnamed: 0" from axis 1 using the method drop(), then use the method describe() to obtain a statistical summary of the data.
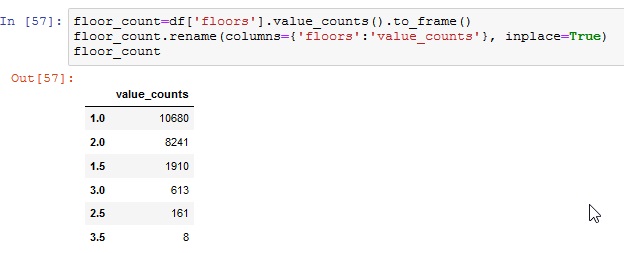
Question 3: use the method value_counts to count the number of houses with unique floor values, use the method .to_frame() to convert it to a dataframe.
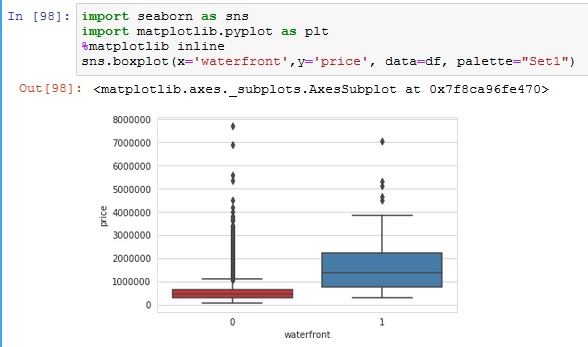
Question 4: use the function boxplot in the seaborn library to produce a plot that can be used to determine whether houses with a waterfront view or without a waterfront view have more price outliers.
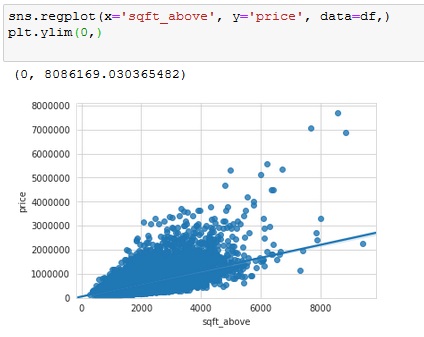
Question 5: Use the function regplot in the seaborn library to determine if the feature sqft_above is negatively or positively correlated with price
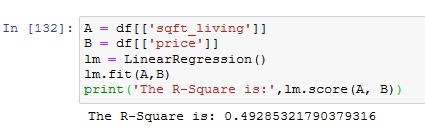
Question 6: Fit a linear regression model to predict the price using the feature 'sqft_living' then calculate the R^2. Take a screenshot of your code and the value of the R^2.
Question 7: Fit a linear regression model to predict the 'price' using the list of features:
• "floors"
• "waterfront"
• "lat"
• "bedrooms"
• "sqft_basement"
• "view"
• "bathrooms"
• "sqft_living15"
• "sqft_above"
• "grade"
• "sqft_living"
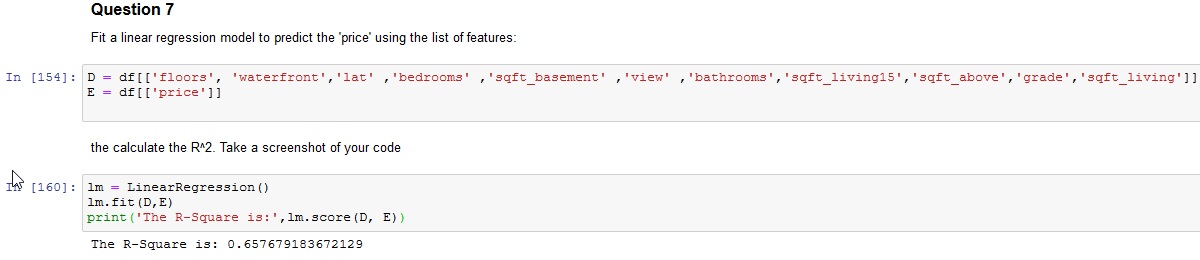
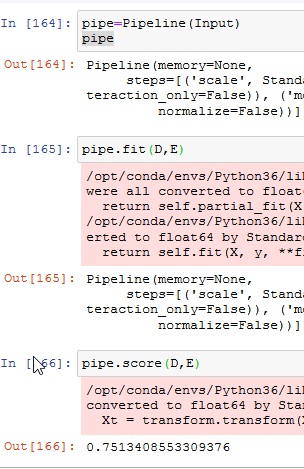
Question 8: Create a pipeline object that scales the data performs a polynomial transform and fits a linear regression model. Fit the object using the features in the question above, then fit the model and calculate the R^2. Take a screenshot of your code and the R^2.
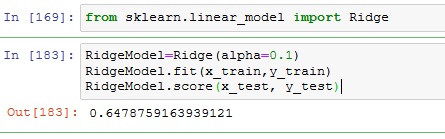
Question 9: Create and fit a Ridge regression object using the training data, setting the regularization parameter to 0.1 and calculate the R^2 using the test data. Take a screenshot for your code and the R^2
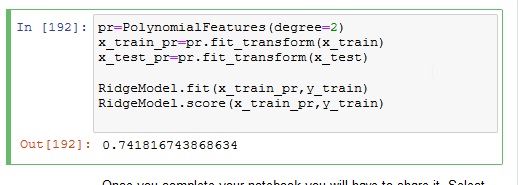
Question 10: Perform a second order polynomial transform on both the training data and testing data. Create and fit a Ridge regression object using the training data, setting the regularisation parameter to 0.1. Calculate the R^2 utilising the test data provided. Take a screenshot of your code and the R^2.
End- Thank you for reading