Data Science Capstone Project: Quantifying Perception & Predicting Work Intentions in Hamilton, ON
Executive Summary
The City of Hamilton is a major part of the 'GTHA' (Greater Toronto Hamilton Area), home to over 540,000 residents. Historically the "black sheep" due to its economic reliance on declining steel manufacturing, Hamilton is now undergoing a revitalization driven by increased investment and innovation in the tech sector, coupled with a rise in migration.
Despite its lower cost of living, Hamilton is struggling to retain the skilled knowledge workers it attracts, many of whom continue to seek employment in larger, more established markets like Toronto or Kitchener-Waterloo that offer more competitive salaries and mature companies. This outflow of talent represents a potential loss of innovation and job creation for the city.
The Dataset
To investigate this talent drain, a 2018 survey targeted McMaster University alumni—recently skilled knowledge workers—to determine their living and working locations. The resulting dataset provides a snapshot of each individual, including variables like their hometown, current city/occupation, perception of Hamilton, willingness to accept a pay cut to work locally, and the importance of factors like safety, culture, and career opportunities. The CSV file had 1,172 records (survey responses) and 52 variables (survey questions or derived features). The dataset contained Personal Identifiable Information (PII) so much of it cannot be shared.
0. Cleaning The Data As a Preliminary Step
The most significant and demanding phase of this project was the preliminary data cleaning. This vital step, which data analysts often estimate takes up to 80% of their time, consumed closer to 90% of our resources due to the highly 'unclean' nature of the survey results.
Here are a few examples of the type of unclean data we had to manage:
Not surprisingly, we had every variation of McMaster University spelled
1. Project Overview: Bridging NLP and Predictive Analytics
This capstone project, completed for the McMaster Data Science Analytics program, delivered an end-to-end analytical solution for the City of Hamilton's economic development office.
The central goal was to understand and predict McMaster University alumni's work and residency intentions regarding Hamilton, a city actively working to transition its economy from heavy industry to a knowledge-based sector. We moved beyond traditional survey analysis by combining Natural Language Processing (NLP) and Predictive Modeling (Logistic Regression) to provide actionable, evidence-based strategy recommendations.
| Analysis Component | Objective | Key Tool |
|---|---|---|
| Text Mining (NLP) | Understand how people describe Hamilton (unfiltered public perception). | R (tm, wordcloud) |
| Predictive Modeling | Determine which perceptions drive the decision to work in Hamilton. | Python (scikit-learn) |
2. NLP & Text Mining Methodology: Extracting the Public Voice 🗣️
The first phase transformed over 1,190 raw, open-ended descriptions of Hamilton from the hamiltonDesc survey field into quantifiable insights using R's text mining capabilities.
Text Cleaning and Corpus Creation (R Code)
This pipeline prepared the messy, raw text for accurate frequency counting.
1 2 3 4 5 6 7 8 9 10 11 12 13 14 15 16 | |
Word Frequency Analysis and Visualization (R Code)
A Document-Term Matrix (DTM) was created to quantify word frequency, which was then visualized as a word cloud.
1 2 3 4 5 6 7 8 9 10 11 12 13 | |
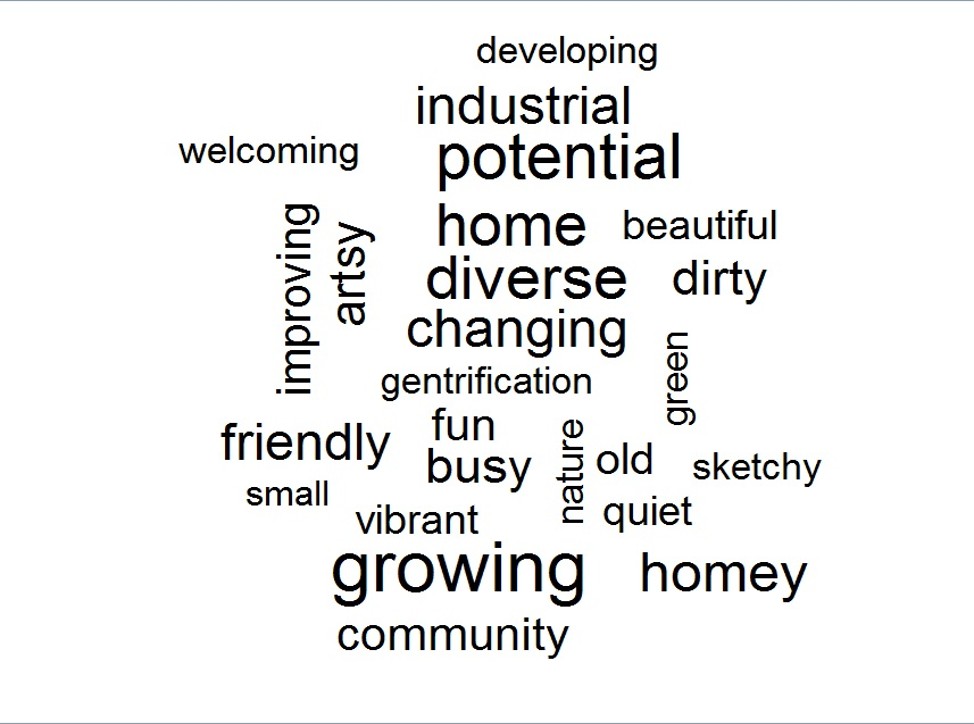
Key Findings: Predominant Themes
The most frequent terms were growing, improving, and developing, confirming that the city's revitalization is widely recognized. Other high-frequency terms like diverse and vibrant highlighted its cultural assets, though terms like industrial and steel showed the historical identity persists.
3. Predictive Modeling: Identifying Decision Drivers 🧠
The second phase built a Logistic Regression Model to determine which perception factors were the most statistically significant drivers of a respondent's interest in Hamilton-based employment.
Model Setup and Training (Python Code)
This Python example outlines the core structure for training the predictive model using scikit-learn.
1 2 3 4 5 6 7 8 9 10 11 12 13 14 15 16 17 18 19 20 21 22 23 24 | |
Key Model Insights
-
Safety is Paramount: The model coefficients showed that a positive perception of city safety was the single most powerful predictor of employment intent.
-
Career Focus: High ratings for career opportunities were the second most influential factor.
-
Culture Secondary: Perception of social life/culture was a weaker driver of employment intent.
4. Technical Challenges & Solutions: The Cleaning Hurdle
A significant portion of the project (approximately 90%) was dedicated to data preprocessing due to poor data quality common in non-time-series, non-standardized surveys.
The Challenge: The survey included non-rigid, open-ended fields that resulted in inconsistent spelling, varying capitalization, and non-standardized answers (e.g., 'Hamilton' was spelled over ten different ways).
The Solution: We used a combination of Python string matching logic and Tableau's visual grouping capabilities to standardize inconsistent categorical answers. Missing and unreasonable numerical values (e.g., ages > 1000) were replaced with the mean of the corresponding feature.
5. Comprehensive Conclusion and Actionable Strategy 💡
The integrated analysis delivered a clear, evidence-based strategy for the City of Hamilton.
| Finding Category | Policy Recommendation |
|---|---|
| Perception Gap | Invest in Public Relations: Actively promote the city's growing and vibrant assets while directly addressing the negative perception of safety and the lingering industrial identity. |
| Decision Drivers | Prioritize Safety & Investment: Focus policy and budget on improving city safety and security, as this is the primary psychological hurdle for attracting knowledge workers. Additionally, continue efforts to attract companies that offer competitive Career Opportunities. |
| Data Strategy | Annualize and Redesign the Survey: Implement a rigid, structured survey annually. This will reduce the massive data cleaning burden and allow for longitudinal tracking of public perception in response to new city policies. |
This capstone project delivered a complete analytical solution, moving from raw, messy data to an end-to-end NLP pipeline and a powerful predictive model, directly addressing a critical municipal economic challenge.
Project Status: Completed (McMaster University Data Science Analytics Capstone)
Languages: R, Python
Dataset: Work Intentions Survey - Hamilton, Ontario (n=1,190)
Analysis Type: Text Mining, Predictive Modeling, Data Preprocessing